Rich Broke or Dead Calculator: How to Use It for Real Retirement Planning
Planning for retirement isn’t just about hitting a savings target — it’s about understanding how long your money might last under real market conditions. After testing multiple retirement planning tools, including Monte Carlo simulators and historical-cycle calculators like FireCalc, the Rich Broke or Dead Calculator stands out for one reason: it visualizes risk in a simple, probability-based format.
Instead of offering a single projection, it runs thousands of scenarios based on your savings, spending, asset allocation, and life expectancy to estimate whether you’re likely to retire comfortably, run out of money, or fall somewhere in between. Used correctly, it can highlight weak points in your retirement strategy and show how small changes — such as lowering withdrawals or adding spending flexibility — can significantly improve long-term outcomes.
In this guide, you’ll learn how the calculator works, what its results really mean, and how to use its projections to strengthen your retirement plan.

What Factors Does It Ask You to Submit
To generate results, the calculator requires basic financial inputs such as your current savings, planned retirement spending, asset allocation, retirement age, and any additional income sources. These figures form the baseline for its projections.
- Current Income: Your yearly earnings before taxes.
- Current Savings: How much you put away each year, both in superannuation and other investments.
- Current Expenses: Your regular outgoings, like bills, rent or mortgage, and daily living costs.
- Desired Retirement Income: The amount you’d like to live on each year once you stop working.
- Retirement Age: The age at which you plan to stop working.
- Existing Savings: The total amount you’ve already accumulated in retirement accounts and investments.
- Other Income Sources: Any pensions, annuities, or other regular payments you expect.
- Major Future Expenses: Significant one-off or ongoing costs you foresee, like aged care or travel.
The calculator uses these figures to project how your savings might perform over time, considering factors like investment growth and inflation. It’s all about building a realistic financial forecast based on your personal circumstances. It’s also important to consider how flexible you are with your spending and income. If you can adjust your expenses or have multiple ways to earn money, that can significantly impact your retirement outlook. The calculator helps you see how these adjustments might play out.
How the Rich Broke or Dead Calculator Calculates Your Retirement Outcome
The Rich Broke or Dead Calculator works by running your personal financial inputs through multiple market and lifespan scenarios to estimate how long your money might last in retirement.
Instead of producing a single projection, it models thousands of possible outcomes using historical market returns and statistical simulations. This approach helps account for uncertainty in investment performance, withdrawal timing, and how long you may live.
At its core, the calculator focuses on three key factors:
• Portfolio growth – based on your asset allocation and assumed market returns
• Withdrawal rate – how much you take from your savings each year
• Longevity risk – the chance you outlive your money
Depending on the version used, results are typically generated through historical market cycles or Monte Carlo simulations. These methods replay past market conditions or create randomized future scenarios to show how your portfolio might perform over time.
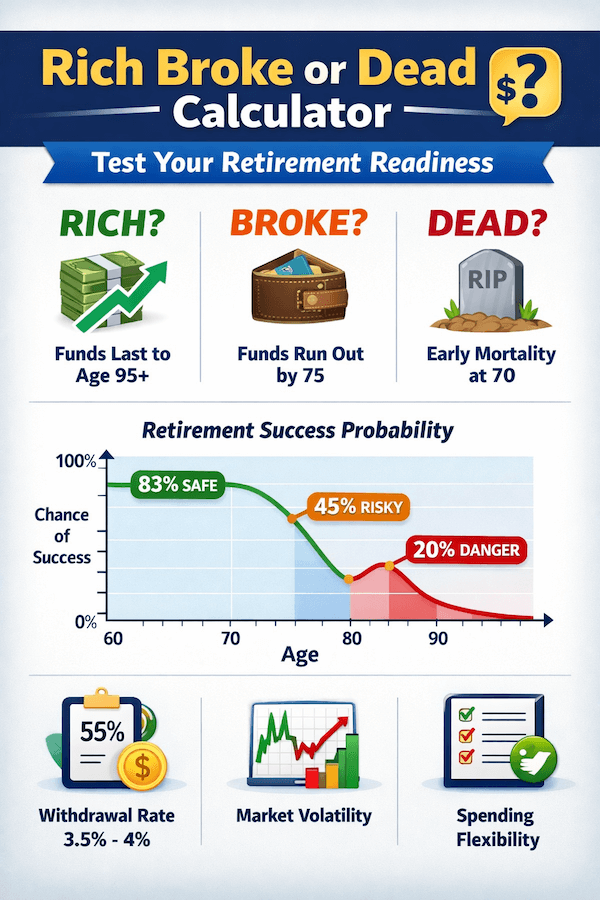
Your results are presented as probabilities across three outcomes:
Rich – Your savings last through retirement in most scenarios, often leaving surplus funds. This indicates a relatively resilient plan.
Broke – A meaningful portion of simulations show your portfolio running out before your projected lifespan, signalling potential financial strain later in retirement.
Dead – The model assumes you pass away before exhausting your savings. While bluntly labelled, this simply reflects statistical life-expectancy assumptions rather than a literal prediction.
Rather than offering guarantees, the calculator displays ranges of outcomes, often showing median results alongside best- and worst-case scenarios. This gives you a clearer picture of risk, not just a single forecast.
If your results lean toward “Broke,” it usually means one or more inputs need adjusting — such as reducing planned spending, increasing savings, modifying asset allocation, or adding income flexibility. Small changes can materially improve success probabilities.

Think of the tool as a risk assessment framework, not a definitive answer. Its value lies in helping you test assumptions and identify vulnerabilities before retirement begins.
Real Example Using the Rich Broke or Dead Calculator
To see how the Rich Broke or Dead Calculator works in practice, here’s a simplified example using typical early-retirement inputs.
Starting age: 60
Planned retirement age: 62
Current portfolio: $750,000
Annual retirement spending: $45,000
Asset allocation: 70% stocks / 30% bonds
Withdrawal rate: ~6% initially
Spending flexibility: 10%
With these inputs, the calculator produced approximately:
• Rich: 68%
• Broke: 22%
• Dead: 10%
In other words, nearly one-third of simulated scenarios showed the portfolio running out before the end of retirement — largely due to the relatively high withdrawal rate combined with retiring early.
Next, only two variables were adjusted:
• Annual spending reduced to $40,000
• Spending flexibility increased to 15%
No additional savings were added.
After those changes, results improved to roughly:
• Rich: 86%
• Broke: 11%
• Dead: 3%
This illustrates one of the calculator’s most valuable insights: modest reductions in spending and small increases in flexibility can dramatically improve retirement sustainability — often more effectively than chasing higher investment returns.
Rather than treating the output as a pass-or-fail result, the real value comes from experimenting with different assumptions. Adjusting withdrawals, delaying retirement by even a year, or adding part-time income can quickly shift outcomes from high risk to relatively stable.
Rich Broke or Dead vs FireCalc vs Monte Carlo Tools
While all three approaches aim to answer the same question — will your money last in retirement? — they do it in very different ways.
| Tool | Method | Best For | Key Limitation |
|---|---|---|---|
| Rich Broke or Dead | Monte Carlo + probability modeling | Visualising risk and trade-offs | Can feel optimistic depending on assumptions |
| FireCalc | Pure historical market cycles | Stress-testing against worst-case history | Doesn’t model modern portfolio behavior |
| Monte Carlo Tools (generic) | Randomized future simulations | Advisor-level planning scenarios | Results vary widely based on inputs |
Rich Broke or Dead focuses on probability ranges and flexibility. It’s especially useful for exploring “what if” scenarios, such as lowering spending or delaying retirement by a year.
FireCalc is typically more conservative. It runs your plan through every historical market sequence since 1871, including severe downturns. If your plan survives FireCalc, it’s usually quite resilient — but many realistic plans fail its strict criteria.
Generic Monte Carlo tools offer the most customization but also depend heavily on assumed return averages and volatility. Two tools can produce very different results from identical inputs.
In practice, many planners use Rich Broke or Dead for probability visualization, FireCalc for downside stress-testing, and Monte Carlo simulators for fine-tuning asset allocation.
Using more than one calculator provides a clearer picture of both opportunity and risk.
How Flexibility Impacts Your Risk of Running Out of Money
Spending flexibility is one of the most powerful variables in the Rich Broke or Dead Calculator. It allows you to model reduced spending during market downturns, which significantly lowers the risk of portfolio depletion. That’s where flexibility comes in, and it’s a pretty big deal when it comes to making sure your money lasts. The Rich Broke or Dead calculator lets you play around with this idea. If your planned retirement spending is, say, $60,000 a year, but you’re willing to trim that back to $50,000 if markets take a nosedive or if you just feel like cutting back a bit, that’s a significant change. The calculator calls this ‘Spending Flex’. It’s basically a percentage of your planned spending that you’re comfortable reducing. So, if you have a 20% Spending Flex, you’re saying you can manage on 80% of your original budget if needed. This flexibility can make a massive difference to your retirement success rate. It’s like having a built-in safety net. Instead of needing a huge nest egg to cover every possible scenario, you can potentially retire earlier or with a smaller pot because you’re willing to adjust your outgoings. Here’s a simplified look at how it might play out:
| Scenario | Planned Annual Spending | Spending Flex | Required Nest Egg (Example) | Success Rate (Example) |
| No Flexibility | $60,000 | 0% | $1,500,000 | 85% |
| Moderate Flexibility (10%) | $60,000 | 10% | $1,350,000 | 95% |
| High Flexibility (20%) | $60,000 | 20% | $1,200,000 | 99% |
Note: These are illustrative figures and depend heavily on other factors like investment returns and lifespan. It’s not just about cutting back, either. For those of us who aren’t quite ready to retire entirely, earning a bit of extra income during retirement can also act as a form of flexibility. If you can bring in, say, $10,000 a year from a part-time gig or a hobby, that’s $10,000 less you need to draw from your investments. This can significantly boost your portfolio’s longevity. The key takeaway is that a rigid plan, expecting to spend a fixed amount regardless of circumstances, is inherently riskier. Building in the capacity to adjust, either by spending less or earning a bit more, provides a buffer that can dramatically improve your chances of a comfortable retirement. So, when you’re using the calculator, don’t just plug in your ideal spending. Think about what you could realistically trim if you had to. Even a small amount of flexibility can have a surprisingly large positive impact on your retirement outlook.
Common Pitfalls & Limitations to Be Aware Of
While the Rich Broke or Dead Calculator is useful for stress-testing retirement plans, it has important limitations.
First, market returns are based on historical data or simulations. Future performance may differ significantly, especially during prolonged downturns or periods of high volatility.
Second, inflation assumptions can materially impact results. If real-world inflation runs higher than modeled, your purchasing power may erode faster than projected.
Life expectancy is another variable. The calculator relies on statistical averages, but individual health, genetics, and lifestyle can cause outcomes to vary widely.
Finally, the tool can’t fully account for unexpected expenses such as major medical costs, family support, or large home repairs — all of which can strain retirement savings.
Use the calculator as a planning guide rather than a prediction. It’s most effective when combined with flexible spending assumptions and regular plan updates as your circumstances change.
Using the Rich Broke or Dead Calculator to Improve Your Retirement Plan
Once you’ve run your numbers through the Rich Broke or Dead calculator, it’s time to get practical. The real power of this tool lies in its ability to show you how tweaking certain inputs can significantly alter your retirement outlook. Once you’ve reviewed your results, focus on adjusting the variables that most affect sustainability:
- Adjust Your Savings Rate: If the calculator shows you’re on track to be ‘Broke’ or ‘Dead’, the most direct lever is increasing how much you save. Even a small boost in your annual savings can make a big difference over time, especially in the early years of your savings journey. Consider cutting back on discretionary spending or exploring ways to increase your income.
- Modify Your Retirement Spending: The calculator often highlights how a reduction in your expected annual spending in retirement can dramatically improve your chances of success. If your initial projections seem grim, look for areas where you can realistically trim your budget. This might involve downsizing your home, reducing travel expenses, or cutting back on other lifestyle costs.
- Experiment with Asset Allocation: While past performance doesn’t guarantee future results, the calculator uses historical data to model different investment mixes. See how shifting your allocation between stocks, bonds, and cash impacts your projected outcomes. A more aggressive allocation might offer higher potential growth but also comes with greater volatility.
- Incorporate Variable Income/Expenses: Life isn’t static. Use the calculator’s features to model specific events, like a planned part-time job in retirement, a one-off inheritance, or significant future expenses like aged care. Adding these streams can provide a more realistic picture of your financial flow.
The most impactful action you can take is to revisit the calculator regularly and make informed adjustments as your circumstances change. The calculator is a dynamic tool. Don’t just run it once and forget it. Treat it as an ongoing part of your financial planning process. Small, consistent adjustments based on its output can steer you away from potential shortfalls and towards a more secure retirement.
Frequently Asked Questions
How Does The Calculator Figure Out If I’ll Be ‘Rich’, ‘Broke’, Or ‘Dead’?
It uses your inputs to run many different possibilities, considering things like how long you might live and how your investments might perform over time. Based on these simulations, it estimates the chances of you having enough money, running short, or sadly, passing away before your money runs out.
Are The Results From This Calculator Guaranteed To Be True?
It’s important to remember this is a simulation, not a crystal ball. Past investment performance doesn’t guarantee future results. Use it as a helpful tool to think about your retirement plan, but don’t rely on it as the absolute truth.
Can I Change My Spending If My Retirement Money Isn’t Stretching Far Enough?
Absolutely! The calculator lets you see how adjusting your spending can affect your chances of success. Being flexible with how much you spend, especially if markets are down, can make a big difference in avoiding running out of money.
What Withdrawal Rate Works Best In This Calculator?
Most users find that withdrawal rates between 3.5% and 4% provide the strongest balance between lifestyle and sustainability. Rates above 4.5% significantly increase the risk of running out of money, especially if markets perform poorly early in retirement. Adding spending flexibility — even 10–15% — can meaningfully improve success rates at higher withdrawal levels.
What’s The Good Chance Of Success According To This Calculator?
There’s no single ‘perfect’ number, as everyone’s situation is unique. However, a higher percentage chance of success means your plan is more likely to work out. Many people aim for a high probability, but it’s about finding a balance that feels right for you.
Is Rich Broke or Dead more conservative than FireCalc?
Not usually. FireCalc tends to be more conservative because it relies strictly on historical market cycles, including worst-case periods like the Great Depression and stagflation years. Rich Broke or Dead typically uses Monte Carlo simulations or blended historical assumptions, which can produce smoother outcomes and higher success probabilities. In practice, FireCalc often shows lower success rates for the same inputs, making it better suited for stress-testing, while Rich Broke or Dead is more useful for visualising probabilities and trade-offs.